Matagorda County offers employers affordable labor with opportunities for funded workforce training. We have skilled laborers accustomed to shift work, and there are 20 higher education institutions within 100 miles that offer certification and degree programs.
The Matagorda County, TX region:
- Has a civilian labor force of 16,568 with a participation rate of 58.7%. .
- Of individuals 25 to 64 in Matagorda County, Texas, 18.8% have a bachelor’s degree or higher which compares with 34.3% in the nation.
- The median household income in Matagorda County, Texas is $48,733 and the median house value is $128,100.”
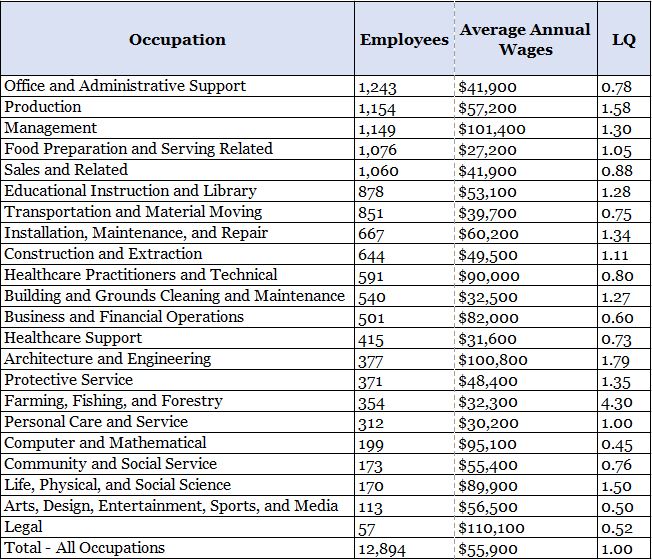
Occupation Snapshot
The largest major occupation group in Matagorda County, Texas is Office and Administrative Support Occupations, employing 1,243 workers. The next-largest occupation groups in the region are Production Occupations (1,154 workers) and Management Occupations (1,149). High location quotients (LQs) indicate occupation groups in which a region has high concentrations of employment compared to the national average. The major groups with the largest LQs in the region are Farming, Fishing, and Forestry Occupations (LQ = 4.30), Architecture and Engineering Occupations (1.79), and Production Occupations (1.58).
Occupation groups in Matagorda County, Texas with the highest average wages per worker are Legal Occupations ($110,100), Management Occupations ($101,400), and Architecture and Engineering Occupations ($100,800). The unemployment rate in the region varied among the major groups from 2.0% among Legal Occupations to 10.7% among Food Preparation and Serving Related Occupations.
Over the next 1 year, the fastest growing occupation group in Matagorda County, Texas is expected to be Personal Care and Service Occupations with a +1.4% year-over-year rate of growth. The strongest forecast by number of jobs over this period is expected for Food Preparation and Serving Related Occupations (+14 jobs) and Healthcare Support Occupations (+6). Over the same period, the highest separation demand (occupation demand due to retirements and workers moving from one occupation to another) is expected in Food Preparation and Serving Related Occupations (211 jobs) and Sales and Related Occupations (152).
Source: JobsEQ®
Data as of 2022Q4 unless noted otherwise
Note: Figures may not sum due to rounding.
- Data based on a four-quarter moving average unless noted otherwise.
- Wage data represent the average for all Covered Employment
- Data represent found online ads active within the last thirty days in the selected region. Due to alternative county-assignment algorithms, ad counts in this analytic may not match that shown in RTI (nor in the popup window ad list). Ad counts for ZCTA-based regions are estimates.
Occupation employment data are estimated via industry employment data and the estimated industry/occupation mix. Industry employment data are derived from the Quarterly Census of Employment and Wages, provided by the Bureau of Labor Statistics and currently updated through 2022Q3, imputed where necessary with preliminary estimates updated to 2022Q4. Wages by occupation are as of 2022 provided by the BLS and imputed where necessary. Forecast employment growth uses national projections from the Bureau of Labor Statistics adapted for regional growth patterns.